Hospitality Report
Mexico hotel industry report 2025: Market intelligence, supply & pipeline analysis
August 2026
This report is tailored specifically for strategic advisors, institutional investors, developers, and key stakeholders across the hospitality, tourism, and real estate sectors. Horwath HTL delivers actionable market intelligence, performance benchmarks, and pipeline analysis designed to guide high-level capital deployment, asset positioning, and strategic decision-making throughout Mexico.
Executive Summary
The Mexican hospitality and tourism sector continues to demonstrate solid fundamentals, cementing its position as the premier hotel market in Latin America and a global powerhouse in destination real estate. In 2025, national tourism GDP reached $2,713,120 million MXN, accounting for an 8.7% share of total national GDP. Hotel supply expanded to an estimated 27,948 establishments (+3.9% YoY) and 909,719 total hotel rooms (+1.15% YoY).
In the global arena, Mexico ranks #3 worldwide in Branded Residences with approximately 200 projects, driven by world-class momentum in Riviera Maya (#6 globally) and Los Cabos (#10 globally). Looking ahead, Mexico dominates the Latin American hotel development pipeline with 247 active projects representing 36,646 rooms – a massive 32.7% regional share.
Branded Residences Landscape
- Global Standing: Mexico ranks #3 globally for branded residential projects with ~200 developments, behind only the United States (~400) and the UAE (~280).
- Price Premium: Projects carry an average 33% global price premium, rising to a 39% premium in resort destinations.
- Destination Dynamics:
- Los Cabos (Global #10): A consolidated, mature market featuring 13 completed and 9 pipeline projects (0.7x pipeline ratio), heavily driven by North American HNWIs seeking ultra-luxury and golf offerings. Anchor brands include Four Seasons, Rosewood, Auberge, and Montage.
- Riviera Maya (Global #6): An accelerated expansion market with 7 completed and 20 pipeline projects (2.9x pipeline ratio), catering to international HNWIs with a focus on wellness and connectivity. Key brands include One&Only, St. Regis, and Rosewood.
Industry Overview and Economic Impact
- Tourism GDP Contribution: In 2025, tourism total GDP reached $2,713,120 million MXN, representing 8.7% of Mexico’s total national GDP.
- Service-Driven Sector: The structure of Mexico’s tourism economy remains heavily service-oriented, with services generating 87.4% ($2,370,721 million MXN) of total sector output. Travel accommodation, reservations, and passenger transport account for over 41% of overall tourism service revenue.
- Economic Engine: High tourism GDP contribution highlights the sector’s critical role as a driver of national economic stability, foreign exchange, and regional development.
Macroeconomic shifts
- Exchange Rate: A strong MXN exchange rate combined with economic slowdowns in key North American source markets created short-term yield sensitivity in dollar-priced resort hubs like Cancun and Los Cabos.
Inventory and Growth
- Hotel Count (2025): 27,948 establishments, up 3.9% from 26,911 properties in 2024.
- Room Inventory: 909,719 rooms, reflecting a 1.15% YoY expansion.
- Geographic Concentration:
- Hotel Establishments: 54.1% are concentrated within 10 key states, led by Jalisco (2,935 properties), Veracruz (2,145), Oaxaca (1,653), Puebla (1,425), and Quintana Roo (1,375).
- Rooms: 58.17% of total key capacity resides in 10 states, with Quintana Roo holding 135,754 rooms (14.9% share) and Jalisco providing 83,394 rooms (9.2% share).
Categories and Market Expansion
- Fastest Growing Segments: 3-star hotels (+3.5% YoY) lead expansion with 5,403 properties, followed closely by 2-star hotels (+2.8% YoY).
- Luxury & Upscale Classes: Both 4-star (3,089 properties) and 5-star (1,763 properties) categories maintained solid growth rates of +2.2% YoY.
- Budget Segment Contraction: 1-star hotels were the only category to experience a contraction (-1.1% YoY, closing at 3,193 properties).
Development Pipeline and Investment
- Regional Leadership: Mexico dominates Latin America’s hotel project pipeline, capturing 32.7% of all active projects (247 projects / 36,646 rooms).
- Top Destination Markets: Mexico City stands as the #1 market for development in Latin America with 29 active projects (3,290 rooms), while Riviera Maya (~15 projects) and Cancun (~9 projects) remain premier resort development hubs.
- Operator Dynamics: Major hotel operators continue aggressive expansion for the 2027–2031 window, led by City Express by Marriott and Esplendor (6 projects each), Holiday Inn Express (6 projects), Hampton by Hilton (4 projects), and Tru by Hilton (4 projects).
Occupancy and Visitor Demand Indicators
- International Arrivals: Mexico welcomed 33.6 million total tourists, including 27.4 million foreign air arrivals.
- Source Markets: Foreign air travel remains heavily reliant on North America, led by the United States (66.5% share) and Canada (13.6% share).
- Performance Leadership: High-tier resort markets and 5-star properties continue to outpace midscale assets in average occupancy and RevPAR performance across primary leisure destinations.
Strategic Insights
- Market Concentration: Investors and developers continue to focus capital on key established hubs (Quintana Roo, Jalisco, Mexico City), though emerging regional corridors present new positioning opportunities.
- Luxury & Branded Growth: Strong buyer appetite for branded residences and luxury hotels provides a resilient hedge against broader economic volatility.
- Strategic Risk Management: Maintaining balance in supply growth and diversifying source market reliance beyond North America remain critical to sustaining long-term sector performance.

Download Report
1. Tourism share of national GDP
According to official data from INEGI’s Tourism Satellite Account of Mexico (CSTM), tourism GDP represents an 8.7% share ($2,713,120 million pesos) of total national GDP ($33,506,847 million pesos). The structure of Mexico’s tourism economy remains heavily service-oriented, with services generating 87.4% of total sector output.
Composition of Mexico tourism GDP (2023–2024)
| Concept | 2023 (MXN Million) | 2024 (MXN Million) | 2023 Share | 2024 Share |
|---|---|---|---|---|
| Country total GDP | $29,952,318 | $31,331,232 | 100.0% | 100.0% |
| Tourism total GDP | $2,558,578 | $2,713,120 | 8.5% | 8.7% |
| Tourism goods (Handicrafts & other) | $312,044 | $342,399 | 12.2% | 12.6% |
| Tourism services (Total) | $2,246,534 | $2,370,721 | 87.8% | 87.4% |
| · Passenger transport | $521,373 | $567,837 | 20.4% | 20.9% |
| · Travel accommodation & reservations | $535,562 | $568,815 | 20.9% | 21.0% |
| · Restaurants, bars & nightclubs | $406,123 | $413,762 | 15.9% | 15.3% |
| · Cultural, sports & recreation | $86,062 | $93,422 | 3.4% | 3.5% |
| · Other services | $697,414 | $726,886 | 27.0% | 27.0% |
2. Hotel inventory and category growth in Mexico
Total hotel supply in Mexico reached an estimated 27,948 establishments in 2025, reflecting a 3.9% increase from 26,911 properties in 2024. Hotel supply is highly concentrated, with 54.1% of all establishments located within 10 key states: Jalisco (2,935 properties), Veracruz (2,145), Oaxaca (1,653), Puebla (1,425), and Quintana Roo (1,375) leading the tally.
In terms of key capacity, total room inventory stood at 909,719 rooms (+1.15% YoY). Ten states account for 58.17% of all hotel rooms in the nation, led by Quintana Roo with 135,754 rooms (14.9% share) and Jalisco with 83,394 rooms (9.2% share).
Hotel room supply by leading states (2024–2025)
| State | 2024 Rooms | 2025e Rooms | YoY Change (%) | 2025 Share |
|---|---|---|---|---|
| Quintana Roo | 132,909 | 135,754 | +2.1% | 14.9% |
| Jalisco | 83,085 | 83,394 | +0.4% | 9.2% |
| Mexico City | 59,416 | 59,166 | -0.4% | 6.5% |
| Veracruz | 52,414 | 52,849 | +0.8% | 5.8% |
| Nayarit | 36,739 | 36,921 | +0.5% | 4.1% |
| Guerrero | 34,363 | 35,857 | +4.3% | 3.9% |
| Guanajuato | 32,040 | 31,524 | -1.6% | 3.5% |
| Puebla | 31,870 | 32,067 | +0.6% | 3.5% |
| Oaxaca | 31,156 | 31,112 | -0.1% | 3.4% |
| Baja California | 29,720 | 30,498 | +2.6% | 3.4% |
| Rest of Mexico | 353,877 | 358,577 | +1.3% | 41.8% |
| Total National Inventory | 899,389 | 909,719 | +1.15% | 100.0% |
Category growth breakdown
By property class, 3-star hotels recorded the fastest expansion rate at +3.5% YoY (reaching 5,403 properties), followed by 2-star hotels at +2.8% (3,783 properties). Both 4-star (3,089 properties) and 5-star categories (1,763 properties) recorded solid growth of +2.2%. The only segment experiencing a contraction was 1-star properties (-1.1%, closing at 3,193 establishments).
3. Branded residences market landscape
The global branded residential sector has nearly tripled over the past decade, reaching 910 active projects by late 2025 (+19% YoY) with an additional 837 contracted pipeline projects projected through 2032. Carrying a global brand provides an average price premium of 33% globally, which climbs to a peak 39% premium in resort markets.
Top 10 global countries for branded residences
| Global Rank | Country | Total Projects |
|---|---|---|
| 1 | United States | ~400 |
| 2 | United Arab Emirates | ~280 |
| 3 | Mexico | ~200 |
| 4 | Vietnam | ~150 |
| 5 | Brazil | ~130 |
| 6 | Thailand | ~120 |
| 7 | Saudi Arabia | ~100 |
| 8 | Egypt | ~90 |
| 9 | Turkey | ~80 |
| 10 | India | ~75 |
Destination comparison: Los Cabos vs. Riviera Maya
Mexico holds two resort destinations in the global Top 10 cities for branded residences. While both benefit from a 39% resort price premium, their pipeline dynamics reveal distinct market maturities:
| Variable | Los Cabos (Global #10) | Riviera Maya (Global #6) |
|---|---|---|
| Completed / Pipeline | 13 completed / 9 pipeline | 7 completed / 20 pipeline |
| Pipeline / Completed Ratio | 0.7x (Consolidated, mature market) | 2.9x (Accelerated expansion window) |
| Primary Buyer Profile | North American HNWI (U.S. West Coast) | HNWI: U.S., Canada, Europe |
| Key Differentiator | Golf, ultra-luxury, capital security | World-class wellness, air connectivity |
| Anchor Brands | Four Seasons, Rosewood, Auberge, Montage | One&Only, St. Regis, Rosewood |

4. Hotel pipeline and construction trends in Mexico
According to Lodging Econometrics, Latin America’s hotel project pipeline stands at 755 projects and 113,663 rooms. Mexico leads the regional market by a wide margin, accounting for 32.7% of all projects in Latin America.
Latin America hotel project pipeline by country
| Country | Projects | Rooms | Regional Share |
|---|---|---|---|
| Mexico | 247 | 36,646 | 32.7% |
| Brazil | 132 | 18,172 | 17.5% |
| Dominican Republic | 84 | 18,014 | 11.1% |
| Colombia | ~31 | ~4,100 | 4.1% |
| Peru | ~30 | ~4,000 | 4.0% |
| Rest of Latin America | 231 | 32,731 | 30.6% |
City-level leadership & operator dynamics
Mexico City ranks as the #1 city in Latin America for hotel development with 29 active projects (3,290 rooms), followed by Lima (18 projects) and Georgetown (15 projects). Riviera Maya (~15 projects) and Cancun (~9 projects) remain premier resort development hubs.
For the upcoming 2027–2031 period, CoStar data identifies 92 top operator projects under development in Mexico. City Express by Marriott and Esplendor lead planned inventory with 6 proposed projects each, followed by Holiday Inn Express (6 projects), Hampton by Hilton (4), Registry Collection (4), and Tru by Hilton (4.
5. Hotel occupancy and demand indicators
Mexico welcomed a total of 33.6 million tourists (27.4 million international air arrivals and 6.6 million overnight border tourists). Foreign air arrivals were heavily dominated by the United States (66.5% share) and Canada (13.6% share). Domestic airline passenger volume reached 63.5 million travelers, with low-cost carriers Viva Aerobus (39.5% market share) and Volaris (34.0% share) leading connectivity.
Occupancy highlights across segments
- Property Class Performance: 5-star properties recorded the highest national occupancy averaging 65.0% (peaking at ~69.2% during Q1 and Q4 high seasons), followed by 4-star properties at 58.0%. Lower-tier categories averaged below 50%.
- Heritage & Urban Destinations: Querétaro led heritage cities with 60.2% occupancy, followed by Mexico City (59.5%) and Puebla (59.1%).
- Beach Destinations: Riviera Maya achieved the highest hotel occupancy relative to available supply, recording an average rate of 70.3% (36,294 daily occupied rooms out of 51,660 available).
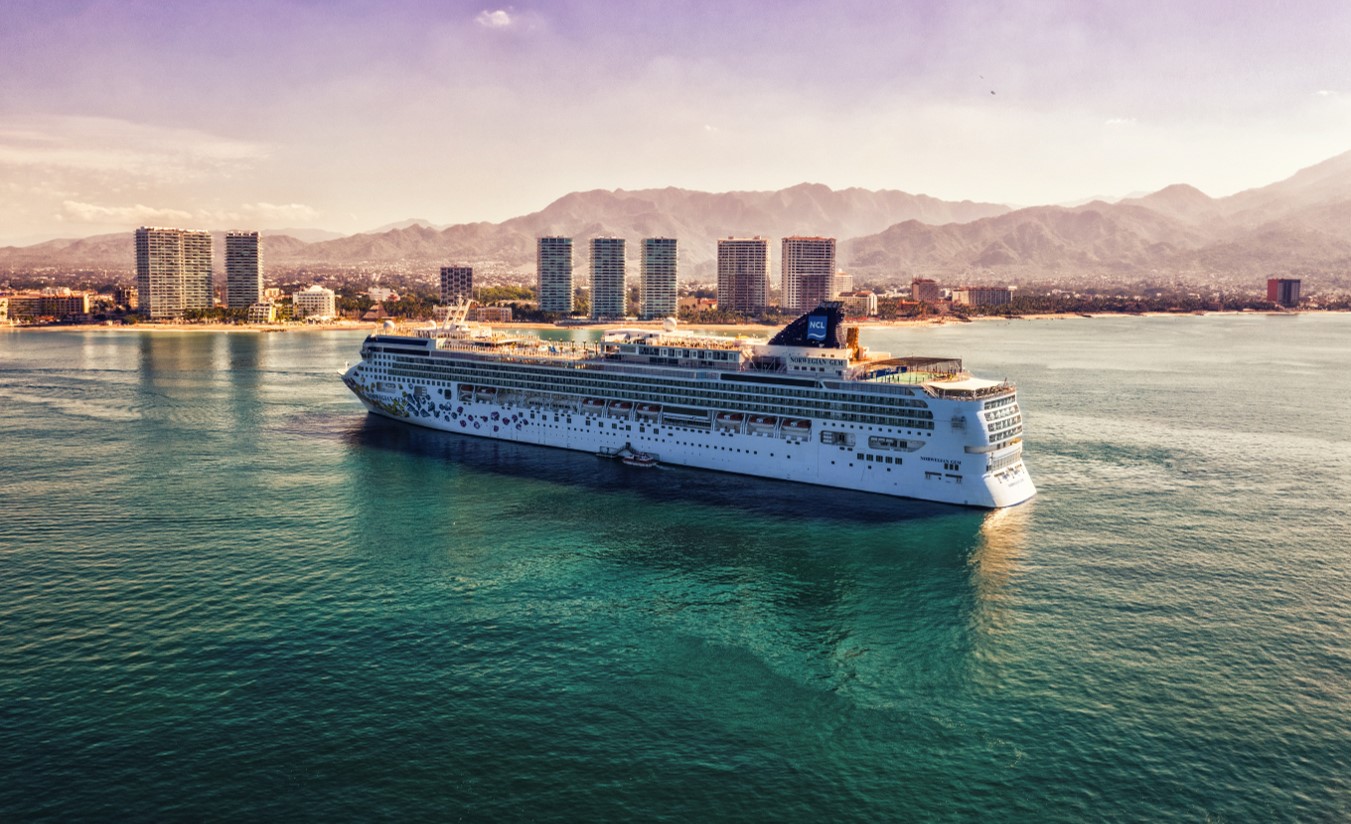
- Cruise Tourism: Cruise ship arrivals reached 3,156 vessels (+14.5% YoY), carrying over 8.4 million passengers. Cozumel (1,299 ships; 4.7M passengers) and Mahahual (571 ships; 2.3M passengers) remained the primary cruise hubs.
 6. Outlook, macro drivers, and strategic considerations
Macroeconomic shifts & World Cup legacy
A strong MXN exchange rate combined with economic slowdowns in key North American source markets created short-term yield sensitivity in dollar-priced resort hubs like Cancun and Los Cabos. Meanwhile, the hosting of the FIFA World Cup across Mexico City, Guadalajara, and Monterrey delivered targeted room-rate surges (+30% to +40% ADR increases on match days). Industry consensus emphasizes that the tournament’s primary dividend lies in sustained international marketing exposure rather than immediate occupancy spikes.
Nearshoring and hybrid asset models
Industrial relocation continues to drive aggressive growth in select-service business hotel demand across the northern corridor (Monterrey, Saltillo, Tijuana, Juárez) and the Bajío region (Querétaro, Guanajuato). Concurrently, institutional investors are increasingly adopting hybrid asset structures—such as condo-hotels, branded residences, and corporate suites—to derisk capex and stabilize long-term yield cycles.
AI adoption vs. high-touch hospitality
While 98% of hoteliers leverage AI for revenue optimization and task automation, 59% maintain that check-in, concierge, and core service delivery must remain strictly human-driven. In luxury and resort environments, high-touch empathy and personalized service remain the irreplaceable core of guest satisfaction.
Frequently asked questions
Q1: What percentage of Mexico’s GDP is generated by the tourism sector?
A: Tourism accounts for an 8.7% share of Mexico’s national GDP ($2,713,120 million MXN), with services driving 87.4% of total sectoral output.
Q2: How does Mexico rank globally in the branded residences market?
A: Mexico ranks #3 globally in branded residences with approximately 200 projects, trailing only the United States and the United Arab Emirates.
Q3: Which state leads Mexico in hotel room supply?
A: Quintana Roo leads the country with 135,754 hotel rooms, accounting for nearly 15% of Mexico’s total room inventory.
Q4: What is Mexico’s share of the Latin American hotel development pipeline?
A: Mexico dominates Latin American hotel development with 247 projects and 36,646 rooms, representing 32.7% of all hotel projects in the region.
Q5: Which hotel category achieved the highest occupancy in Mexico?
A: The 5-star hotel category achieved the highest average occupancy at 65.0%, outperforming 4-star (58.0%) and midscale properties.