Introduction
The substantial expansion of the short-term rental (STR) market, driven by online booking platforms has faced significant backlash in recent years.
This is especially true in traditionally tourism-focused destinations, where the uncontrolled growth of STRs imposes increasing challenges in environmental, social and economic contexts. Consequently, managing STR’s growth has become a widely discussed topic among governments and destination managers who seek solutions to minimise the unquestionable negative effects.
The first step in developing effective management strategies for STRs is to measure their current state through revenues, supply and demand.
Soci

Short-Term Rental Analytics & Data
Liftoff
At the country level, the financial performance of the STR market showed growth across all indicators.
Gross revenue surged from EUR 11.8 billion in 2019 to EUR20.3 billion in 2023, marking a 72% increase.
2023 room rates are 50% higher that in 2019.
The five largest markets – France, the UK, Italy, Spain, and Germany – collectively accounted for 74% of the total STR revenue in 2023 in Europe.
Just 10 countries, out of 27 measured here, generate 90% of the revenue.
Revenue in France grew 93% between 2019 and 2023. In the same period Italy 87%, Spain 72% and UK 56%.
Even Germany with some of the strictest legislation grew 32%.
Revenue has almost doubled since 2019
In 2023, available beds across Europe’s nations ranged from a mere 3,000 to over 2 million.
France, with 2.67 million beds, dominates the scene, nearly doubling the STR capacity of Italy and quadrupling that of Croatia.
Supply is still recovering from Covid
Occupancy was higher in 2022 than 2023.
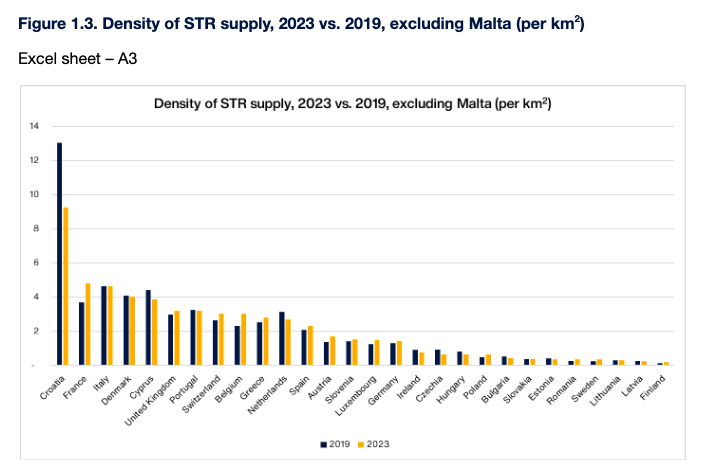
Croatia has constantly led the pack in density per capita and, although the decrease between 2019 and 2023 in density is visible, this is contributed to still recovering supply from the influence of pandemic.
France Gross Revenue 2023
Portugal Change in Monthly Revenue 2019-2023
Croatian ADR Increase 2019-2023
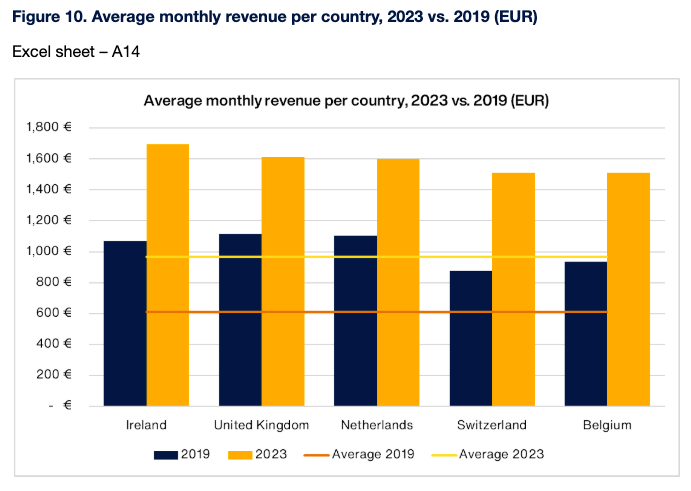
Average Monthly Revenue
STRs continue to be a lucrative business and investment opportunity
The attractiveness of operating STRs is further highlighted by the rise in average monthly revenue per available listing (RevPAL).
This metric jumped from EUR 611 in 2019 to EUR 965 in 2023, signalling strong demand for these properties across Europe.

Supply
Occupancy rates on the rise
The majority of analysed countries saw a rise in occupancy from 2019 to 2023, with only eight countries experiencing a decline. Estonia had the most significant decrease (-21%), while other drops ranged from -5% to -1%. Interestingly, occupancy rates were generally higher across the board in 2022, with just three countries exceeding their 2022 occupancy in 2023.
This decline in 2023 can potentially be attributed to an influx of new STRs entering the market, outpacing the growth in overnight.
Back in 2019, Belgium (39.3%), Luxembourg, (37.4%) and the UK (35.6%) were leading. But by 2023, Malta had surged to the top, boasting a 44.2% occupancy rate, while Belgium and Luxembourg still performed strongly at 39.7% and 38.0%, respectively.
Demand
Demand surges 20% since 2019
The European STR market has seen a significant surge in demand over recent years, reflecting the growing appeal of this accommodation option. In 2019, STRs across the region recorded a robust 140.3 million overnight stays.
By 2023, this figure had jumped nearly 20% to 167.4 million overnights, marking a clear upward trend in traveller preferences.
Four countries dominate
France
– 29% share of supply
– 2.66m available beds
– 31% increase 19-23
– Density per area: 5

Italy
– 15% share of supply
– 1.4m available beds
– 0.17% increase 19-23
– Density per area: 5

Spain
– 13% share of supply
– 1.17m available beds
– 12.5% increase 19-23
– Density per area: 2

UK
– 8% share of supply
– 770k available beds
– 6.7% increase 19-23
– Density per area: 3

Movers and shakers
Overnights
– Romania +43%
– Finland +34%
– Greece +32%
– Poland +28%
Occupancy
– Cyprus +9%
– Malta +9%
– Portugal +8%
– Bulgaria +7%
2019-2023 change


Revenue
– Romania +195%
– Poland +141.61%
– France +92%%
– Greece +91%
ADR
– Hungary +99%
– Slovenia +96%%
– Romania +90.53%
– Lithuania +75%%
2019-2023 change
Malta Occupancy 2023
Romania revenue increase 2019-23
Hungary increase in ADR 2023
Space. The final frontier?

STR Supply Density
Elbow room
The overwhelming sense we get from the cities that are pushing back hardest is that there are overrun and there is no space. They may have a point, Venice in August anyone?
One of the key metrics to look at has to be density of supply. This is a basic calculation to show how many rentals there are in a certain area.
There are two measurements we look at, density per population and density per square kilometre. If we are looking for culprits that would explain the backlash against short-term rental rentals, is this a good place to start?
In many markets this number has gone down since 2019, although perhaps significantly, Spain is not one of them.

STR Ranking Table
European country STR data
STR accommodation capacity
Density of STR supply per area
Density of STR supply per population
STR Overnights
Occupancy
Gross market revenue
Monthly revenue per available listing
Average Daily Rate
Rang
Country
Canvi %
1
Sweden
102,352
149,323
45.89%
2
Finland
43,307
61,061
41.00%
3
Poland
151,115
202,862
34.24%
4
France
2,029,459
2,666,078
31.37%
5
Belgium
70,774
92,265
30.37%
6
Romania
63,521
81,052
27.60%
7
Austria
115,615
142,886
23.59%
8
Luxembourg
3,188
3,823
19.92%
9
Switzerland
109,485
125,485
14.61%
10
Spain
1,047,875
1,179,746
12.58%
11
Germany
462,243
515,881
11.60%
12
Greece
325,581
358,181
10.01%
13
Slovenia
28,519
30,590
7.26%
14
United Kingdom
722,950
771,658
6.74%
15
Slovakia
17,740
18,428
3.88%
16
Italy
1,396,871
1,399,191
0.17%
17
Denmark
174,735
172,440
-1.31%
18
Portugal
298,452
292,091
-2.13%
19
Lithuania
19,214
18,598
-3.21%
20
Latvia
16,927
15,621
-7.72%
21
Cyprus
40,665
35,728
-12.14%
22
Malta
32,581
28,390
-12.86%
23
Netherlands
129,618
111,797
-13.75%
24
Estonia
18,134
15,440
-14.86%
25
Ireland
76,681
64,504
-15.88%
26
Bulgaria
58,415
46,710
-20.04%
27
Hungary
76,764
60,999
-20.54%
28
Czechia
72,571
52,186
-28.09%
29
Croatia
738,265
523,686
-29.07%
Overcrowding or Overtourism?
Conclusion
The narrative emerging from the European STR market is one of stark contrasts and looming challenges. The data reveals a market that is not just growing but evolving in ways that create clear winners and losers, both among countries and within their tourism sectors.
As the STR market surges, the real story lies in the uneven distribution of benefits and burdens, raising urgent questions about sustainability, regulation, and the future of European tourism.
The truth is of course very complicated, some cities like Paris have just become so used to tourists that the answer to every question seems to be more tourists. Is this because the infrastructure is better developed than other countries that are struggling? Hardly, but its very size and diversity of tourism product allows it to divert tourists to other areas.
We believe that this data shows the difference between overcrowding and over tourism is effective destination management. This means a combination of the right legislation, the right incentives but also embracing smart new technologies that help destination management organisations create sustainable tourism.

All of the data in the report was provided by AllTheRooms, with the exception of visitor numbers which were provided by GlobalData. All of the copy and analysis was done by Horwath HTL. Whereas all efforts have been made to verify the accuracy and validity of the data, and the data is believed to be accurate at time of publishing, this cannot be guaranteed. AllTheRooms and Horwath HTL reserve all rights.


